

DOT, the token from Polkadot, is currently still in the Validation Area where investors form price structures that lead to trend clarity, so this is an interesting ‘Playing Area’ for this crypto.
Now, based on data from Coin Market Cap (CMC), at the time of writing, DOT has a market capitalization of $36,423,729,535 and a daily trading volume of $3,085,645,083 which makes this crypto ranked 8th in market capitalization.
And if we compare it to 2020, the market capitalization has increased very rapidly along with the increasing use of technology from Polkadot, the company behind the crypto DOT, which is certainly an adoption that will increase the prospects of the crypto.
4 Hour Chart Technical
At the time of writing, the DOT is still recovering as reflected in its price structure, so Bullish will be the basis for our analysis in the coming days, adhering to the Validation Area ‘principle’ which we will discuss on the Daily chart.
In our technical view, the bulls are starting to form an important level for him, which can be used as a handle on which to base the analysis on this chart.
Here I try to describe it in the 4-hour technical chart below:
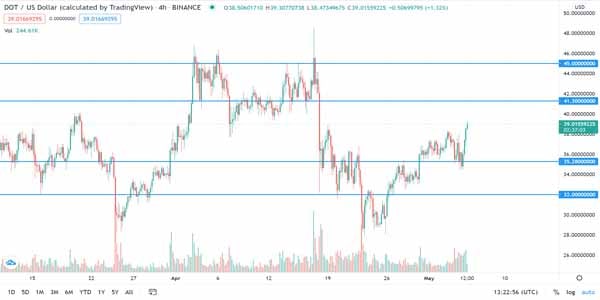
Based on the picture above, the price in the past few days is still trying to rise along with Polkadot’s capable performance, where the point of this latest increase is now one of the Key Support levels that underlies Bullish opportunities.
In my view, at this time frame, the DOT price will still face a Key Resistance level on its Bullish journey at $41.3, which is the point that needs to be reached for the price to maintain an upside existence and a Bullish opportunity, besides, there is a Support level Locks at $ 32 and $ 35.28 are our monitoring points, where prices will still have the opportunity to rise, as long as prices are able to bounce off these levels.
Daily Chart Technical:
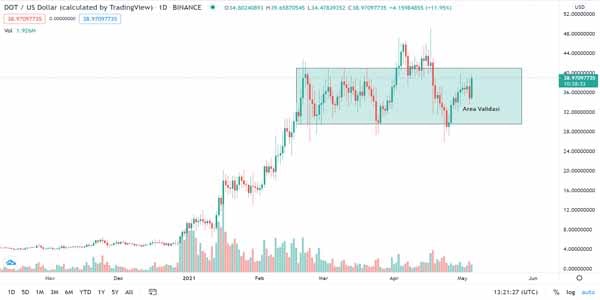
And also, in the medium-term view, we map this Polkadot token in the Validation Area formed from the High-Low point of February – March, where we see, the price needs to break one of the boundaries of this Area to clarify the medium-long term trend.
In view of this analysis, the bulls still have a chance as long as the price is able to maintain its position based on the analysis on the 4-hour chart, which remains alert to the potential for rejection or false breakouts in each boundary of the Validation Area if the accompanying volume is not strong enough (in the range or below the average).
And for the Bearish scheme, the price failed to fall from the upper limit of the Validation Area and continued to fall down until it reached the Support levels on the 4-hour chart, where a breakdown of these levels would be a ‘bloody’ signal that we need to watch out for!
(*)


