

BNB, the native token of crypto exchange Binance, is now on the way back by reaching its ATH range after breaking out of its previous Bearish pattern, reflecting the positive attitude of investors towards this token and it’s “Keyword”.
Now, based on data from Coin Market Cap (CMC), at the time of writing, BNB has a market capitalization of $94,680,096,872 and a daily trading volume of $3,675,630,777 which makes this crypto ranked 3rd in terms of market capitalization. And if we compare it to 2020, the market capitalization has experienced a very rapid increase as new crypto investors are increasingly interested in crypto joining through Binance and also liking the features in it, including the Binance Smart Contract (BSC).
4 Hour Chart Technical
At the time of writing, BNB has been in a capable bullish structure with no significant selling resistance. This indicates a Bullish domination attempt which can be used as a handle for us in the next few days.
In my technical view, the bulls still have the potential to dominate again because apart from an on-rallying technical structure, BNB’s fundamentals will still be positive because investors still have a lot of optimistic views on crypto and continue to enter this exchange to trade, or enjoy another key feature to make money.
Here I try to describe it in the 4-hour technical chart below:
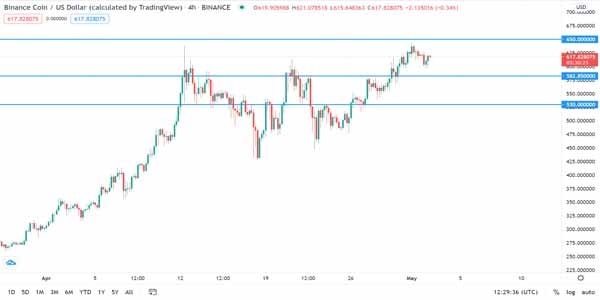
Based on the picture above, the price has formed a new High in Multi-Week which is the Bullish basis, where you should be alert for opportunities to form a Higher Low before a rally is formed.
In my view, at this time frame, BNB has Key Support-Resistance (SR) levels that are capable enough for us to use as handles in validating potential trends, namely at the Support levels of $ 530, $ 582.85 and Resistance of $ 650.
In my Bullish view, the Support levels are the bounce points (in case of a decline first) to bring the price back on-rally, where a breakdown of them, will signal us to beware of Multi-Day Bearishness.
Daily Chart Technical:
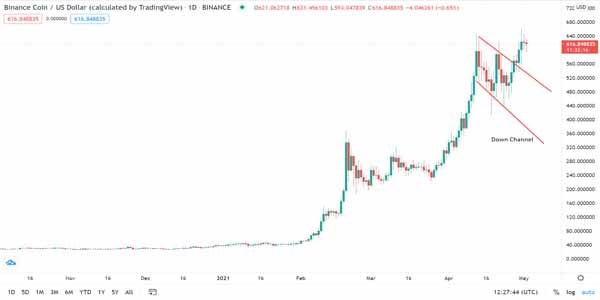
Also, in the medium term view, this Binance token has returned in an attractive Bulls structure after breaking out of the upper boundary of the Down Channel pattern so we can see the market optimism from there.
In view of this analysis, we can meet Bullish if the price forms a pattern such as Continuation, Correction, or Pullback after strengthening, where the $ 560 level is a crucial point for validating the trend opportunity that I analyzed.
And for the Bearish scheme, the price forms several strong Bearish candles to bring it into the Down Channel again, so this can be watched out for as a Reversal attempt to become a “W” pattern.
And from a fundamental viewpoint, Binance has a strong non-technical foundation, with the support of strong long term investor interest in crypto, that will keep Binance shining, and also its BSC which will continue to lift BNB to positive levels in the long term.
(*)


