

Bitcoin (BTC) has now formed a new low after a few days of critical selling pressure, where the price is now back below the $ 50,000 level on which investors are optimistic.
Now, based on data from CoinMarketCap (CMC), at the time of writing, BTC has a market capitalization of $928,598,605,363 and a daily trading volume of $94,531,807,563 which still places it as the number one cryptocurrency. However, compared to 2020, the market cap has seen a very rapid rise as institutional interest in BTC has grown.
Short Term Technicals
At the time of writing, Bitcoin has fallen far enough from its ATH level that technically, one might say one of the ‘bloody’ drops has worried some investors.
In our technical view, Bearish is trying to take control of the market in a trend dominance, so it will be very interesting for us to find out whether there is still potential for Bitcoin to rally again.
Here we try to describe it in the 2-hour technical chart below:
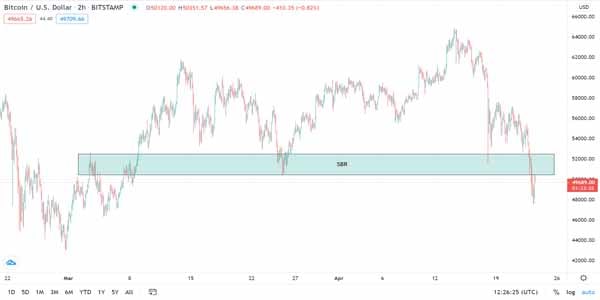
Based on the picture above, the price is below the quite ‘fresh’ Support Become Resistance (SBR) Area, because it came from the previous Low Level that underlies the Swing Bullish at the end of March.
In my view, the SBR Area will be the main validation point for the trend, where whether or not prices are able to build recovery momentum around this Area, will be a potential trend signal in the short and medium term, where the role of institutions will be very large here in increasing volume which will underlying the action of Bulls, or Bears.
Medium Term Technical
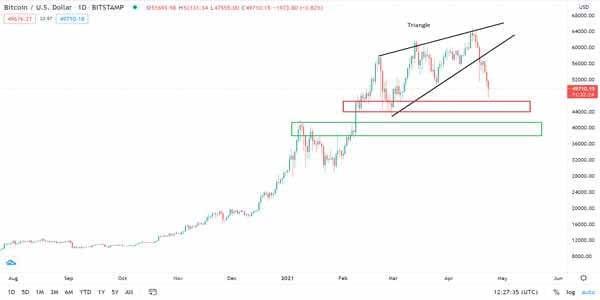
On the other hand, in the mid-term view on the Daily chart above, Bitcoin (BTC) has now fallen quite strongly and away from its Triangle pattern which became a kind of Bearish signal, after a new Low was formed from this decline.
In view of this analysis, we have two Key Support Areas to find out, how likely is the Bullishness to continue, namely the Red and Green Box Support Areas, which are mapped from past Swing levels.
The bullish scheme is, the price is building up momentum on one of the Support Areas while testing it, which will certainly be an interesting point for investors because the price fall below the $50,000 level has been such a big blow that it needs big money support (from institutions) to trigger interest from retail investors.
In a Bearish scheme, the price continues to fall hard and break down the existing Support Area, so a potential for a more severe ‘bleed’ is looming, which could touch the $30,000 level or lower.
And for a fundamental view, the decline in the last few days is the result of the actions of the US government which created panic among investors, so of course this cannot be said to be a strong bearish sentiment because globally, crypto, especially Bitcoin, has won a place in the hearts of big players such as institutions. and even big companies like Tesla and MicroStrategy, so the long-term outlook on this major crypto we still see as strong bullish which requires the patience of its investors.
(*)


